The funders had no role in study design, data collection and analysis, decision to publish, or preparation of the manuscript.[...]quantitative data (interval or ratio) that assume numeric values can be further classif...
详细信息
The funders had no role in study design, data collection and analysis, decision to publish, or preparation of the manuscript.
[...]quantitative data (interval or ratio) that assume numeric values can be further classified as either discrete or continuous. * Discrete (countable) variables assume only whole numbers and some kind of count.
Numeric values for color or code are different because we are encouraged to think about colors as numbers in a specific color space.
[...]since discrepancies may arise between the numbers we choose and the output color, color spaces should be perceptually uniform.
[...]efforts were made to create perceptually uniform color spaces.
Utilizing visualization-oriented Natural Language Interfaces (V-NLI) as a complementary input modality to direct manipulation for visual analytics can provide an engaging user experience. It enables users to focus on ...
详细信息
Utilizing visualization-oriented Natural Language Interfaces (V-NLI) as a complementary input modality to direct manipulation for visual analytics can provide an engaging user experience. It enables users to focus on their tasks rather than having to worry about how to operate visualization tools on the interface. In the past two decades, leveraging advanced natural language processing technologies, numerous V-NLI systems have been developed in academic research and commercial software, especially in recent years. In this article, we conduct a comprehensive review of the existing V-NLIs. In order to classify each article, we develop categorical dimensions based on a classic information visualization pipeline with the extension of a V-NLI layer. The following seven stages are used: query interpretation, data transformation, visual mapping, view transformation, human interaction, dialogue management, and presentation. Finally, we also shed light on several promising directions for future work in the V-NLI community.
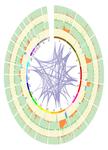
We present a new technique for visualizing high-dimensional data called cluster MDS (cl-MDS), which addresses a common difficulty of dimensionality reduction methods: preserving both local and global structures of the...
详细信息
We present a new technique for visualizing high-dimensional data called cluster MDS (cl-MDS), which addresses a common difficulty of dimensionality reduction methods: preserving both local and global structures of the original sample in a single 2-dimensional visualization. Its algorithm combines the well-known multidimensional scaling (MDS) tool with the k-medoids data clustering technique, and enables hierarchical embedding, sparsification and estimation of 2-dimensional coordinates for additional points. While cl-MDS is a generally applicable tool, we also include specific recipes for atomic structure applications. We apply this method to non-linear data of increasing complexity where different layers of locality are relevant, showing a clear improvement in their retrieval and visualization quality.
From state-of-the-art visualization algorithms, we distill six working principles which are, by hypothesis, sufficient to produce visual projections qualitatively similar to those obtained with these state-of-the-art ...
详细信息
From state-of-the-art visualization algorithms, we distill six working principles which are, by hypothesis, sufficient to produce visual projections qualitatively similar to those obtained with these state-of-the-art algorithms. These working principles are presented through the geometrical reasoning of the classical Multidimensional Scaling algorithm, and their effectiveness is illustrated through a novel straightforward algorithm for data visualization. We show, using several datasets originated from various applications, that our algorithm can produce visual projections qualitatively similar to those obtained with these state-of-the-art algorithms. Besides, under the same motivation (of simplification), the problem of visualizing large datasets is tackled through a companion algorithm which is able to embed new input patterns.
In this paper a rational cubic function in the form of cubic/quadratic, with three shape parameters has been developed. data dependent sufficient constraints are derived for one of these shape parameter to preserve th...
详细信息
ISBN:
(纸本)9789881925169
In this paper a rational cubic function in the form of cubic/quadratic, with three shape parameters has been developed. data dependent sufficient constraints are derived for one of these shape parameter to preserve the shape of constrained data that is lying above the straight line. Remaining two of these shape parameters are left free for designer's choice to refine the shape of the curves as desired. The shape preserving interpolating scheme is tested through different numerical examples and showing that the scheme is not only C2, local, computationally economical and visually pleasant but also guarantee the designer to refine the constrained curve as per industrial demand.
Computer sliders are a generic user input mechanism for specifying a numeric value from a range. For data visualization, the effectiveness of sliders may be increased by using the space inside the slider as l an inter...
详细信息
The global networked infrastructure, also known as the Internet of Things (IoT), has been embedded into various hardware and software to enable communication capabilities and serves as one of the significant influence...
详细信息
Existing approaches to data visualization are one of these two: accessible to end-user developers but limited in customizability, or inaccessible and expressive. For instance, commercial charting tools are easy to use...
详细信息
Existing approaches to data visualization are one of these two: accessible to end-user developers but limited in customizability, or inaccessible and expressive. For instance, commercial charting tools are easy to use, but support only predefined visualizations, while programmatic visualization tools support custom visualizations, but require advanced programming skills. We show that it is possible to combine the learnability of charting tools and the expressiveness of visualization tools. Uvis is an interactive visualization and user interface design tool that targets end-user developers with skills comparable to spreadsheet formulas. With Uvis, designers drag and drop visual objects, set visual properties to formulas, and see the result immediately. The formulas are declarative and similar to spreadsheet formulas. The formulas compute the property values and can refer to data from database, visual objects, and end-user input. To substantiate our claim, we compared Uvis with popular visualization tools. Further, we conducted usability studies that test the ability of designers to customize visualizations with our approach. Our results show that end-user developers can learn the basics of Uvis relatively fast.
This paper aims to describe the prospective methodology (Pictorial Analysis) of a human-computer interaction capable to select and adjust visual representations for better feature and pattern selection. As an adequate...
详细信息
This paper aims to describe the prospective methodology (Pictorial Analysis) of a human-computer interaction capable to select and adjust visual representations for better feature and pattern selection. As an adequate tool for on-line monitoring and diagnosis of very complex systems which require human supervision in addition to the computerized one, our approach exploits human capabilities of pattern recognition in doing data analysis and selecting appropriate representations, features and class descriptions by means of interactive human-computer learning. It is based on the analysis of multidimensional relations through transforming the initial data (heterogeneous arrays, signals and fields) into artificial pictures. Practical applications of this approach prove it extremely useful in critical areas of safety, such as flight control, power plant monitoring, etc. (C) 2003 Published by Elsevier Science Inc.
The Internet of Things (IoT) provides unprecedented opportunities for the access to and conflation of a myriad of heterogeneous data to support real-time decision-making within smart environments. Augmented Reality (A...
详细信息
The Internet of Things (IoT) provides unprecedented opportunities for the access to and conflation of a myriad of heterogeneous data to support real-time decision-making within smart environments. Augmented Reality (AR) is on cusp of becoming mainstream and will allow for the ubiquitous visualization of IoT derived data. Such visualization will simultaneously permit the cognitive and visual binding of information to the physical object(s) to which they pertain. Important questions exist as to how one can efficiently filter, prioritize, determine relevance and adjudicate on individual information needs in support of real-time decision making. To this end, this paper proposes a novel AR decision support framework (STARE) to support immediate decisions within a smart environment by augmenting the user's focal objects with assemblies of semantically relevant IoT data and corresponding suggestions. In order to evaluate this technique, a remote user study was undertaken within a simulated smart home environment. The evaluation results demonstrate that the proposed Semantic Augmented Reality decision support framework leads to a reduction in information overloading and enhanced effectiveness, both in terms of IoT data interpretation and decision support.


暂无评论