Static or dynamicgraphs are typically visualized by either node-link diagrams, adjacency matrices, adjacency lists, or hybrids thereof. In particular, for the case of a changing graph structure a viewer wishes to be ...
详细信息
Static or dynamicgraphs are typically visualized by either node-link diagrams, adjacency matrices, adjacency lists, or hybrids thereof. In particular, for the case of a changing graph structure a viewer wishes to be able to visually compare the graphs in a sequence. Doing such a comparison task rapidly and reliably demands for visually analyzing the dynamicgraph for certain dynamic patterns. In this paper we describe a novel dynamic graph visualization that is based on the concept of smooth density fields generated by first splatting the link information of a given graph in a certain layout or visual metaphor. To further visually enhance the time-varying graph structures we add user-adaptable isolines to the resulting dynamicgraph representation. The computed visual encoding of the dynamicgraph is aesthetically appealing due to its smooth curves and can additionally be used to do comparisons in a long graph sequence, i.e., from an information visualization perspective it serves as an overview representation supporting to start more detailed analysis processes. To demonstrate the usefulness of the technique we explore real -world dynamicgraph data by taking into account visual parameters like visual metaphors, node-link layouts, smoothing iterations, number of isolines, and different color codings. In this extended work we additionally incorporate matrix and list splatting while also supporting the selection of density regions with overlaid link information. Moreover, from the selected graph the user can automatically apply region comparisons with other graphs based on global and local density properties. Such a feature is in particular useful for finding commonalities, hence serving as a special filtering function. (C) 2017 Elsevier Ltd. All rights reserved.
In this article, we investigate the problem of visually representing and analyzing large dynamic directed graphs that consist of many vertices, edges, and time steps. With this work we do not primarily focus on graph ...
详细信息
In this article, we investigate the problem of visually representing and analyzing large dynamic directed graphs that consist of many vertices, edges, and time steps. With this work we do not primarily focus on graph details but more on achieving an overview about long graph sequences with the major focus to be scalable in vertex, edge, and time dimensions. To reach this goal, we first map each graph to a bipartite layout with vertices in the same order for each graph supporting a preservation of the viewer's mental map. A sequence of graphs is placed in a left-to-right reading direction. To further reduce link crossings, we draw partial links with user-definable lengths and finally apply edge splatting as a concept to emphasize graph structures by color coding the generated density fields. Time-varying visual patterns can be recognized by inspecting the changes in the color coding in certain regions in the display. We illustrate the usefulness of the approach in two case studies investigating call graphs changing during software development with 21 releases which is a rather short graph sequence but contains several thousand vertices and edges. Visual scalability in the time dimension is shown with more than 1000 graphs from a dynamic social network dataset consisting of face-to-face contacts acquired during the Hypertext 2009 conference recorded by radio-frequency identification badges.
Visualizing dynamicgraphs is challenging due to the many data dimensions to be displayed such as graph vertices and edges with their attached weights or attributes and the additional time dimension. Moreover, edge di...
详细信息
Visualizing dynamicgraphs is challenging due to the many data dimensions to be displayed such as graph vertices and edges with their attached weights or attributes and the additional time dimension. Moreover, edge directions with multiplicities and the graph topology are also important inherent features. However, in many dynamic graph visualization techniques each graph in a sequence is treated the same way, i.e., it is visually encoded in the same visual metaphor or even in the same layout. This visualization strategy can be problematic if the graphs are changing topologically over time, i.e., if a sparse graph becomes denser and denser over time or a star pattern is changing into a dense cluster of connected vertices. Such a dynamicgraph data scenario demands for a visualization approach which is able to adapt the applied visual metaphor to each graph separately. In this paper we describe the dynamicgraph wall to solve this problem by using multiple visual metaphors for dynamicgraphs which are computed automatically by algorithms analysing each individual graph based on a given repertoire of graph features. The biggest issue in this technique for the graphdynamics, however, is the preservation of the viewer's mental map at metaphor changes, i.e., to guide him through the graph changes with the goal to explore the data for time-varying patterns. To reach this goal we support the analyst by an interactive highlighting feature but we also display graphs in comparative metaphor rows to visually investigate the commonalities and differences over time.
Depicting change captured by dynamicgraphs and temporal paths, or trails, is hard. We present two techniques for simplified visualization of such data sets using edge bundles. The first technique uses an efficient im...
详细信息
Depicting change captured by dynamicgraphs and temporal paths, or trails, is hard. We present two techniques for simplified visualization of such data sets using edge bundles. The first technique uses an efficient image-based bundling method to create smoothly changing bundles from streaming graphs. The second technique adds edge-correspondence data atop of any static bundling algorithm, and is best suited for graph sequences. We show how these techniques can produce simplified visualizations of streaming and sequence graphs. Next, we show how several temporal attributes can be added atop of our dynamicgraphs. We illustrate our techniques with data sets from aircraft monitoring, software engineering, and eye-tracking of static and dynamic scenes.
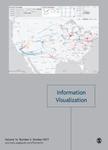
In this paper, we present a visual analysis system to explore sparse traffic trajectory data recorded by transportation cells. Such data contains the movements of nearly all moving vehicles on the major roads of a cit...
详细信息
In this paper, we present a visual analysis system to explore sparse traffic trajectory data recorded by transportation cells. Such data contains the movements of nearly all moving vehicles on the major roads of a city. Therefore it is very suitable for macro-traffic analysis. However, the vehicle movements are recorded only when they pass through the cells. The exact tracks between two consecutive cells are unknown. To deal with such uncertainties, we first design a local animation, showing the vehicle movements only in the vicinity of cells. Besides, we ignore the micro-behaviors of individual vehicles, and focus on the macro-traffic patterns. We apply existing trajectory aggregation techniques to the dataset, studying cell status pattern and inter-cell flow pattern. Beyond that, we propose to study the correlation between these two patterns with dynamic graph visualization techniques. It allows us to check how traffic congestion on one cell is correlated with traffic flows on neighbouring links, and with route selection in its neighbourhood. Case studies show the effectiveness of our system.
Large dynamic networks are targets of analysis in many fields. Tracking temporal changes at scale in these networks is challenging due in part to the fact that small changes can be missed or drowned-out by the rest of...
详细信息
Large dynamic networks are targets of analysis in many fields. Tracking temporal changes at scale in these networks is challenging due in part to the fact that small changes can be missed or drowned-out by the rest of the network. For static networks, current approaches allow the identification of specific network elements within their context. However, in the case of dynamic networks, the user is left alone with finding salient local network elements and tracking them over time. In this work, we introduce a modular DoI specification to flexibly define what salient changes are and to assign them a measure of their importance in a time-varying setting. The specification takes into account neighborhood structure information, numerical attributes of nodes/edges, and their temporal evolution. A tailored visualization of the DoI specification complements our approach. Alongside a traditional node-link view of the dynamic network, it serves as an interface for the interactive definition of a DoI function. By using it to successively refine and investigate the captured details, it supports the analysis of dynamic networks from an initial view until pinpointing a user's analysis goal. We report on applying our approach to scientific coauthorship networks and give concrete results for the DBLP data set.
We introduce a novel technique for visualizing dense time-varying directed and weighted multi-graphs with an additional hierarchical organization of the graph nodes. Combining Indented Tree Plots and TimeRadarTrees, w...
详细信息
ISBN:
(纸本)9780769544762
We introduce a novel technique for visualizing dense time-varying directed and weighted multi-graphs with an additional hierarchical organization of the graph nodes. Combining Indented Tree Plots and TimeRadarTrees, we show the temporal evolution of relations in a static view. The graph edges are layered around thumbnail wheels consisting of color-coded sectors that are representatives of the graph nodes. These sectors generate implicit representations of graph edges. Start and target vertices are perceived by inspecting the color coding of sectors in the context of other sectors and their orientations. The technique puts emphasis on newer relations and hence, these are mapped to a larger display space in the radial diagram. The benefit of our technique is reduction of visual clutter from which node-link diagrams typically suffer. The visualization focuses on an easy exploration of trends, countertrends, periodicity, temporal shifts, and anomalies in time-varying relational data. We demonstrate the usefulness of the approach by applying it to dense dynamicgraph data acquired from a soccer match of the 2D Soccer Simulation League.


暂无评论